DELAFIELD, Wis. (Stockpickr) -- Trading stocks that trigger major breakouts can lead to massive profits. Once a stock trends to a new high, or takes out a prior overhead resistance point, then it's free to find new buyers and momentum players that can ultimately push the stock significantly higher.
One example of a successful breakout trade I flagged recently was basic materials player Cliffs Natural Resources (CLF), which I featured in Aug. 5's "5 Stocks Ready to Break Out" at around $20.50 a share. I mentioned in that piece that shares of CLF recently formed a double bottom chart pattern at $15.50 to $15.41 a share. After bottoming, this stock entered a strong uptrend with shares moving higher $15.41 to over $20 a share. That move was quickly pushing shares of CLF within range of triggering a near-term breakout trade above some key overhead resistance levels at $20.30 to $21.96 a share.
Guess what happened? Shares of CLF didn't wait long to trigger that breakout after the stock briefly pulled back to around $20 a share. On Aug. 8, shares of CLF ripped sharply to the upside with heavy volume as the stock started to flirt with those key breakout levels. Then on August 9 shares of CLF exploded to the upside with big volume as the stock trended above $24.50 a share. This stock touched a recent high of $25.95 a share, which represents a powerful gain of just over 25% in a very short timeframe.
Breakout candidates are something that I tweet about on a daily basis. I frequently tweet out high-probability setups, breakout plays and stocks that are acting technically bullish. These are the stocks that often go on to make monster moves to the upside. What's great about breakout trading is that you focus on trend, price and volume. You don't have to concern yourself with anything else. The charts do all the talking.
Trading breakouts is not a new game on Wall Street. This strategy has been mastered by legendary traders such as William O'Neal, Stan Weinstein and Nicolas Darvas. These pros know that once a stock starts to break out above past resistance levels, and hold above those breakout prices, then it can easily trend significantly higher.
With that in mind, here's a look at five stocks that are setting up to break out and trade higher from current levels.
Apple
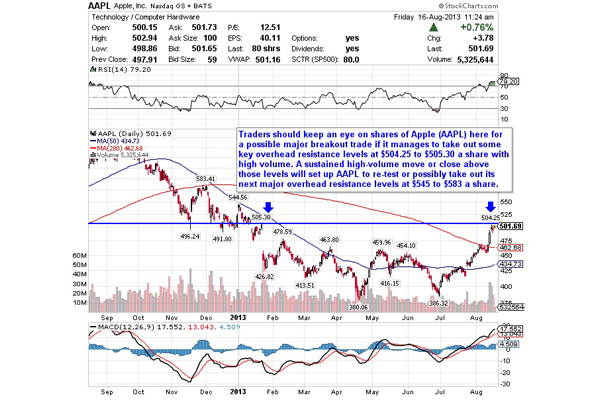
One name that's quickly pushing within range of triggering a big breakout trade is Apple (AAPL), which designs, manufactures and markets personal computers, mobile communication devices, media devices and portable digital music and video players and sells a variety of related software, services, peripherals and networking solutions. This stock has been on fire during the last three months, with shares up sharply by 15.5%.
If you take a look at the chart for Apple, you'll notice that this stock has been uptrending strong for the last month and change, with shares skyrocketing higher from its low of $386.32 to its recent high of $501.62 a share. During that uptrend, shares of AAPL have been consistently making higher lows and higher highs, which is bullish technical price action. That move has now pushed shares of AAPL within range of triggering a big breakout trade.
Traders should now look for long-biased trades in AAPL if it manages to break out above some key overhead resistance levels at $504.25 to $505.30 a share with high volume. Look for a sustained move or close above those levels with volume that hits near or above its three-month average volume of 12.53 million shares. If that breakout hits soon, then AAPL will set up to re-test or possibly take out its next major overhead resistance levels at $545 to $583 a share.
Traders can look to buy AAPL off any weakness to anticipate that breakout and simply use a stop that sits right below some near-term support at $490 a share, or just below $480 a share. One could also buy AAPL off strength once it takes out those breakout levels with volume and then simply use a stop that sits a comfortable percentage from your entry point.
Amarin
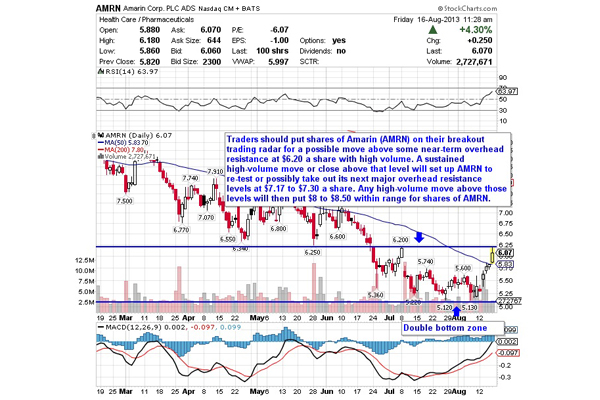
Another stock that looks poised to trigger a major breakout trade is Amarin (AMRN), a biopharmaceutical company that commercializes and develops therapeutics to improve cardiovascular health. This stock has been under pressure by the bears so far in 2013, with shares off sharply by 26%.
If you take a look at the chart for Amarin, you'll notice that this stock has been downtrending badly for the last six months, with shares dropping from over $9 to its recent low of $5.12 a share. During that downtrend, shares of AMRN have been consistently making lower highs and lower lows, which is bearish technical price action. That said, shares of AMRN have now formed a double bottom chart pattern $5.12 to $5.13 a share and are starting to trend back above its 50-day moving average of $5.82 a share. That move is quickly pushing shares of AMRN within range of triggering a major breakout trade.
Traders should now look for long-biased trades in AMRN if it manages to break out above some near-term overhead resistance at $6.20 a share with high volume. Look for a sustained move or close above that level with volume that hits near or above its three-month average action 3.77 million shares. If that breakout hits soon, then AMRN will set up to re-test or possibly take out its next major overhead resistance levels at $7.17 to $7.30 a share. Any high-volume move above those levels will then put $8 to $8.50 within range for shares of AMRN.
Traders can look to buy AMRN off any weakness to anticipate that breakout and simply use a stop that sits right below some key near-term support levels at $5.13 to $5.12 a share. One could also buy AMRN off strength once it takes out those breakout levels with volume and then simply use a stop that sits a comfortable percentage from your entry point.
This stock is another favorite target of the bears, since the current short interest as a percentage of the float for AMRN is very high at 17.4%. This stock could easily experience a powerful short-squeeze if it triggers that breakout soon, so make sure to keep this name on your radar.
Wynn Resorts
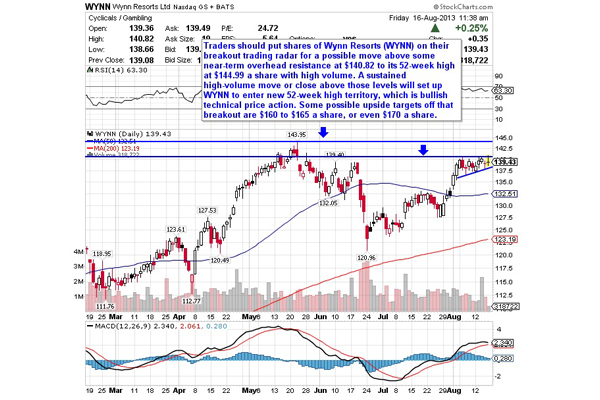
One gambling player that's starting to move within range of triggering a near-term breakout trade is Wynn Resorts (WYNN), a developer, owner and operator of destination casino resorts. This stock has been trending hot so far in 2013, with shares up 24%.
If you look at the chart for Wynn Resorts, you'll notice that this stock has been uptrending strong for the last two months, with shares moving higher from its low of $120.96 to its intraday high of $140.82 a share. During that uptrend, shares of WYNN have been consistently making higher lows and higher highs, which is bullish technical price action. Shares of WYNN have been consolidating for the last few weeks, moving between just below $137 to just above $140 a share. A high-volume move above the upper-end of its recent sideways trading chart pattern could trigger a big breakout trade for shares of WYNN.
Traders should now look for long-biased trades in WYNN if it manages to break out above some near-term overhead resistance at $140.82 to its 52-week high at $144.99 a share with high volume. Look for a sustained move or close above those levels with volume that hits near or above its three-month average action of 1.30 million shares. If that breakout triggers soon, then WYNN will set up to enter new 52-week-high territory, which is bullish technical price action. Some possible upside targets off that breakout are $160 to $165 a share, or even $170 a share.
Traders can look to buy WYNN off any weakness to anticipate that breakout and simply use a stop that sits right below its 50-day moving average of $132.51 a share. One can also buy WYNN off strength once it takes out those breakout levels with volume and then simply use a stop that sits a comfortable percentage from your entry point.
Organovo
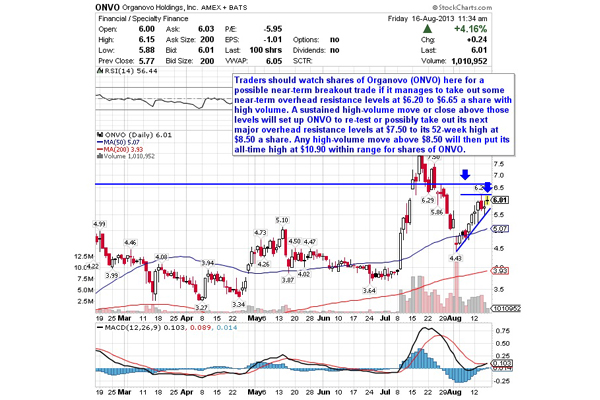
Another stock that's starting to move within range of triggering a near-term breakout trade is Organovo (ONVO), a three-dimensional biology company focused on delivering breakthrough bioprinting technology and creating tissue on demand for research and medical applications. This stock has been on fire so far in 2013, with shares up sharply by 133%.
If you look at the chart for Organovo, you'll notice that this stock recently pulled back sharply from its high of $8.50 to its recent low of $4.43 a share. During that move, shares of ONVO were consistently making lower highs and lower lows, which is bearish technical price action. That said, the downside volatility stopped for ONVO once it hit $4.43 a share, and the stock has now reversed its downtrend and entered an uptrend. That move is quickly pushing ONVO within range of triggering a near-term breakout trade.
Traders should now look for long-biased trades in ONVO if it manages to break out above some near-term overhead resistance levels at $6.20 to $6.65 a share with high volume. Look for a sustained move or close above those levels with volume that hits near or above its three-month average action of 2 million shares. If that breakout triggers soon, then ONVO will set up to re-test or possibly take out its next major overhead resistance levels at $7.50 to its 52-week high at $8.50 a share. Any high-volume move above $8.50 will then put its all-time high at $10.90 within range for shares of ONVO.
Top Dividend Companies To Invest In Right Now
Traders can look to buy ONVO off any weakness to anticipate that breakout and simply use a stop that sits right below its 50-day at $5.07 a share, or just below $5 a share. One can also buy ONVO off strength once it takes out that breakout levels with volume and then simply use a stop that sits a comfortable percentage from your entry point.
Eagle Bulk Shipping
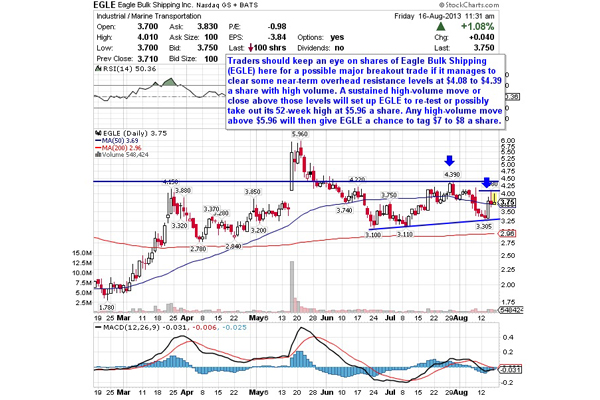
My final breakout trading prospect is Eagle Bulk Shipping (EGLE), whose business activities include ocean transportation of a range of major and minor bulk cargoes, including iron ore, coal, grain, cement and fertilizer, along worldwide shipping routes. This stock has been ramping huge to the upside so far in 2013, with shares up by 163%.
If you look at the chart for Eagle Bulk Shipping, you'll notice that this stock has been trending sideways inside of a consolidation chart pattern for over the last two months and change, with shares moving between $3.10 on the downside and $4.39 on the upside. Shares of EGLE have now started to bounce strongly right off its 50-day moving average of $3.69 a share, and that move is quickly pushing EGLE within range of triggering a big breakout trade.
Traders should now look for long-biased trades in EGLE if it manages to break out above some near-term overhead resistance levels at $4.08 to $4.39 a share with high volume. Look for a sustained move or close above those levels with volume that hits near or above its three-month average action of 760,091 shares. If that breakout triggers soon, then EGLE will set up to re-test or possibly take out its 52-week high at $5.96 a share. Any high-volume move above $5.96 will then give EGLE a chance to tag $7 to $8 a share.
Traders can look to buy EGLE off any weakness to anticipate that breakout and simply use a stop that sits right below some key near-term support at $3.30 a share, or below $3.10 a share. One could also buy EGLE off strength once it clears those breakout levels with volume and then simply use a stop that sits a conformable percentage from your entry point.
This stock is very popular among the short-sellers, since the current short interest as a percentage of the float for EGLE is extremely high at 17.3%. If that breakout hits soon, then EGLE could easily explode sharply higher as the bears rush to cover some of their short bets.
To see more breakout candidates, check out the Breakout Stocks of the Week portfolio on Stockpickr.
-- Written by Roberto Pedone in Delafield, Wis.
No comments:
Post a Comment